

Region Comparison
The top panels are similar to the chromosome diagram and gene map at the top of the Region in Detail view in the Location tab. More than one species can be shown in the panels. Patches and haplotypes can be viewed against the reference sequence, and paraloges can be compared.
Genomes for multiple species can be displayed graphically in the lower panel. This page shows chromosomes, scaffolds and contigs as they are. Whole genome alignments may be displayed. Note: The align slice page diagrams the alignments themselves.
Select Species
Select or remove a species by using the Select species button at the left of the page. Multiple species may be added to the view.
The Main Panel
The species you are coming from (for example if you were in the gene or transcript tab, or another view in the location tab) is shown in the first panel. Genes are drawn by default.
Display Aligned Regions
Turn on the LastZ pairwise alignments using the Select species button at the left.
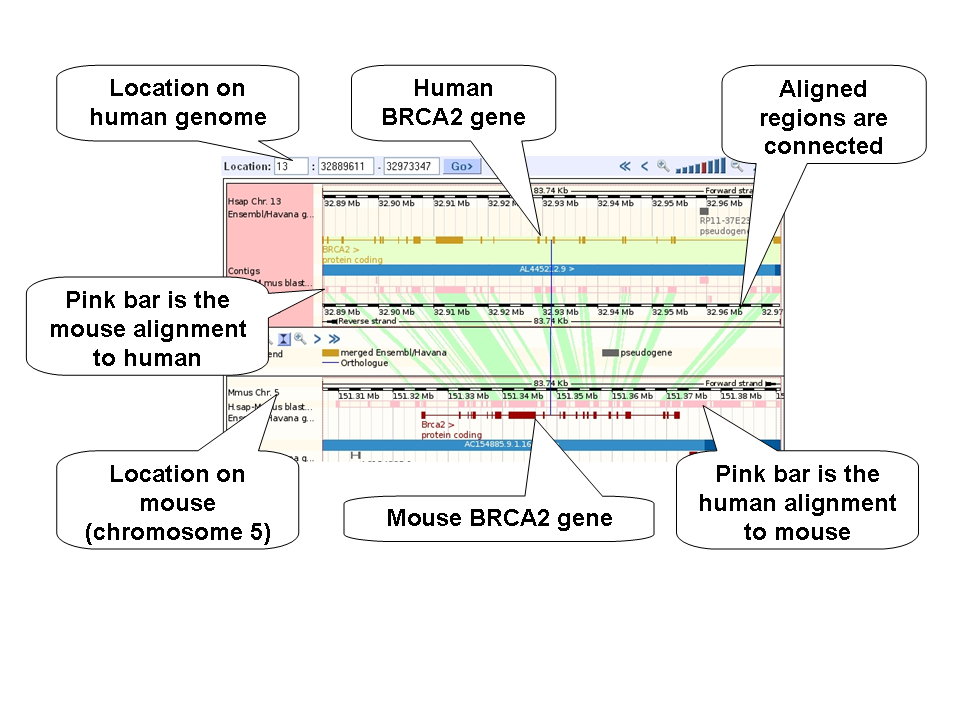
The image above shows human chromosome 13, base pairs 32,889,611 to 32,973,347 and the corresponding region in mouse (chromosome 5). BRCA2 is indicated in both human (gold gene) and mouse (red gene). The pink bar shown the pairwise alignment between human and mouse genomes. Click on the pink bar to see the chromosome and coordinates (in base pairs) of the alignment. Green shading connects the alignments.
Customise the view using the Configure this page toolbar. You can select the species in the Select Species tab at the top of the configuration dialog. See below:

To see a blue line connecting homologous genes, click on the Configure multi-species image tab and under Comparative features select join genes. See below:

The main panel of the configuration menu also allows display of different tracks, such as variations and ESTs (Expressed Sequence Tags) aligned to the genome.
Zoom in or out by using the zoom slide, or the plus and minus buttons at the bottom of each panel. The panel may also be flipped in orientation or realigned using the buttons below the image. Click and drag a box with your mouse around any region to zoom in to that region.