

Linkage Disequilibrium Data
This view displays detailed information on linkage disequilibrium (LD), a measure of the non-random association of alleles at two or more loci that descend from a single and ancestral chromosome.
The commonly used summaries D' and r2 have been calculated.
D' is the difference between the observed and the expected frequency of a given haplotype. If two loci are independent (i.e. in linkage equilibrium and therefore not coinherited at all), the D' value will be 0.
r2 is the correlation between a pair of loci. It varies from 0 (loci are in complete linkage equilibrium) to 1 (loci are in complete linkage disequilibrium and coinherited). Note that only LDs with r2 values larger than 0.05 are available in Ensembl.
The page shows the Ensembl genes and other genomic features annotated in the region such as SNPs, structural variants, etc. This can be customised by clicking on the 'Configure this page' button or on the cog wheel in the image. We also display the LD plot (s). In the centre of these plots, we give the genomic position of a SNP and show all LD values that are contained in a 20 kb region both upstream and downstream of this SNP.
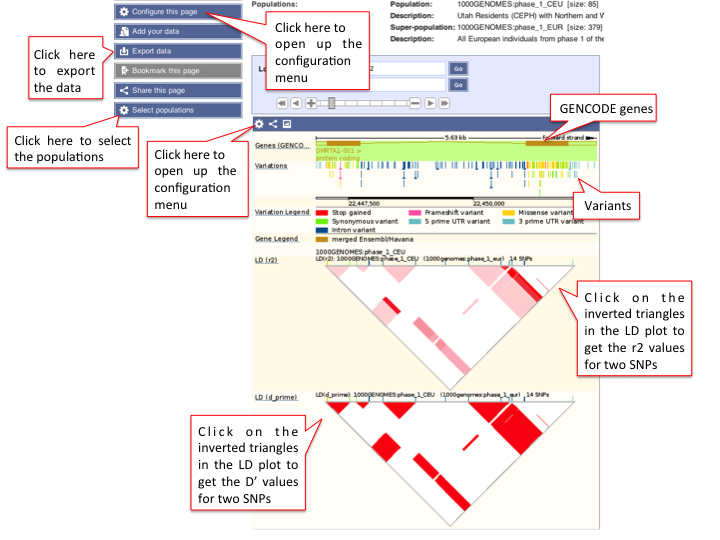
LD values between any two variants in these plots are graphically displayed using inverted coloured triangles varying from white (low LD) to red (high LD). Hover over and click on the inverted triangle (s) to get the LD value between any two SNPs.
You can select to view LD data for different populations by clicking on the 'Select populations' button in the left hand side. To export this data as HTML, Text, Excel or as a format for upload into Haploview, simply click on the 'Export data' button in the left hand side.