

Population genetics
For the top panel describing variation details such as source and class, see this help page.
Populations: Who was studied? Data from multiple projects is available for a range of species and for human these are divided into subpopulations where possible.
1000 Genomes Project samples are separated into five super-populations: AFR, AMR, EAS, EUR, and SAS and 26 more specific populations. See mouse-over help or this FAQ for a description of what they mean.
Pie charts
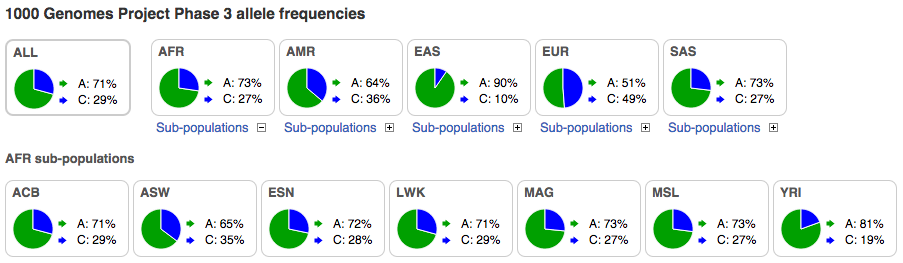
Pie charts can be displayed for 1000 Genomes allele frequencies. If a pie chart is shown on the view for the 1000 Genomes Project, it represents the distribution of the alleles in a 1000 genomes population for a specific variation. Hover over the population three-letter codes to get their names. The super populations are shown on the top-row. Click on a plus alongside Sub-populations to open up the pie charts for the sub-populations, which are then shown on the row(s) below.
In the example above, 73% of the alleles found in the African population studied (AFR) are A (frequency of 0.73), and 27% are C. The sub-populations for the AFR population have been opened up and are displayed on the row below.
Frequency tables
Frequencies are grouped by project for studies with multiple subpopulations (including 1000 Genomes, TOPMed and gnomAD for human, NextGen for goat).
The populations studied are shown in the first column. Allele frequencies and counts are followed by the genotype frequencies and counts. The final column, Genotype detail allows you to jump to the individual genotypes for that population.
The first row shows a summary all the individuals in that study and is highlighted in yellow. The populations are then grouped, with the super population (in blue) followed by its sub-populations (white and grey).
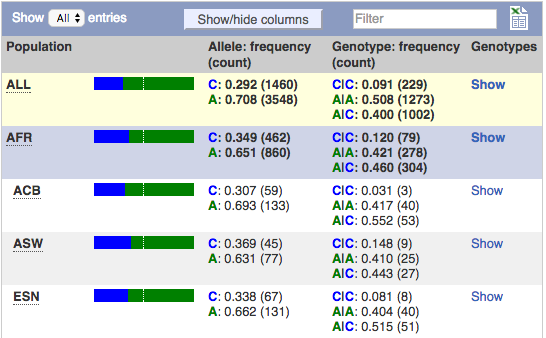
This example is taken from the same variant as the pie charts above.